Tools We Use: Chrome Developer Tools
by Jason Unger, Founder
Insights / Digital Ink /
This is the third in an irregular series of blog posts about the tools we use to design, develop and maintain websites and the digital products we create. We’ve previously written about the Pingdom Website Speed Test and Sprout Social.
I spent a ton of time debugging things. If something online doesn’t work for one of our clients, I’m usually the guy who figures it out.
It’s never easy – especially when there’s a lot of possibilities for what’s causing whatever the issue is. But when it’s a code issue – HTML, CSS, JavaScript or something else – I’ve got an amazing tool that helps me hunt down the problem.
Built into Google’s Chrome web browser is Chrome Developer Tools, the easiest way to see and manipulate live code on any site, check for script errors and more.
What It Does: Everything
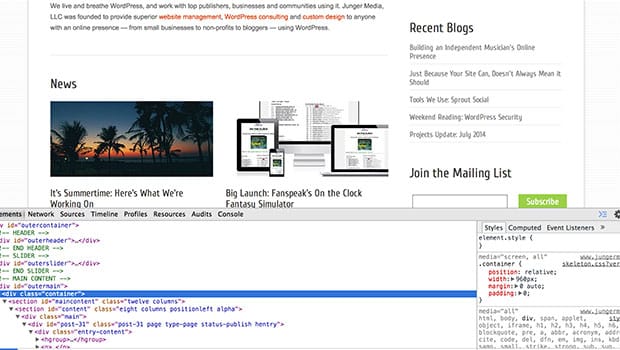
Developer Tools lets you easily see everything that’s going on with the page you’ve got open. You can edit HTML inline, add and remove styles in your stylesheets, view loading times for your elements, and a lot, lot more.
(This page from Google outlines basically everything DevTools can do; give it a read if you want to get a detailed look at the capabilities.)
To open Developer Tools, it’s as easy as right-clicking anywhere on the page and selecting “Inspect Element.” The Tools panel will open at the bottom of the browser, defaulting to showing you the HTML code and styles associated with the page.
How We Use It: To Solve Almost Any Problem
We use Developer Tools differently depending on the issue we’re focusing on, but most of the time, it’s getting used to making styling changes to the elements on the page.
If we need to change the position on an element, or figure out why a style isn’t being applied, or need to make wholesale changes to a page, it’s so much easier to make the changes using Developer Tools. Since it changes the code in your browser (but not the actual site code), you get to preview the changes you’re making without worrying about making a mistake.
A client recently had a problem where some basic functionality on their site wasn’t working, and nothing had changed on our end that would have caused it. Using Developer Tools, we were able to find that code from their advertising partner was being generated incorrectly, and let them know so it could be fixed.
Chrome isn’t the only browser that has these types of tools built in. Firebug for Firefox has is often considered the pioneer in this space. Apple’s Safari has Web Inspector. Internet Explorer offers a set of Developer Tools, which they recently touted in an Ask Me Anything over at Reddit.
Even though I’m a regular user of Safari, when it comes to doing QA and preparing for styling changes, Chrome Developer Tools is the tool I use.
About Jason Unger
Jason Unger is the Founder of Digital Ink. He built his first website on Geocities, and hasn't looked back since. Digital Ink tells stories for forward-thinking businesses, mission-driven organizations, and marketing and technology agencies in need of a creative and digital partner.
Other Stories You May Like